
This is something that comes up a lot during our consultations with Queens homeowners, and while it may seem like a simple answer (Spring/Summer) the truth is that the Fall & Winter offer other benefits like less competition which can help you get more or better offers because you’re not up against so many more houses in your area. So, because of the frequency of this question, I wanted to dig deep into the data and find out exactly what month is best to list your house or apt in Queens. Here are my findings, feel free to use them as a reference point but keep in mind that the best time to sell is the time that’s right for you. In other words, when the timing is right and you’re ready for the transition, that’s when you should sell. As long as you have a good Queens real estate agent and price your property right, you should always be able to have success with your sale!
The way I went about collecting data for this post was by checking information recorded with our Multiple Listing Service (LIBOR). Most properties that are sold in Queens are listed on the MLS so this is where we can get the best infomration. In addition to this, off market listings and for sale by owners are not actually on the market (i.e. Fully exposed) so their stats are not as relevant).
The numbers I wanted to pull & review for this research were average sales statistics for homes & apts listing in each particular month of the calendar year. The stats that I thought would be most telling are Average Days on Market, Average List-to-Sale Price Ratio, # of New Listings, and # of Expired listings as a percentage of the amount of New Listings from each particular month. (https://romantichoneymoonisland.com/)
So, this is where I will geek out but hopefully you can follow the numbers and logic in my findings 🙂 If not, let me know.
So which month is the Best to Sell your House in Queens?
NOTE:
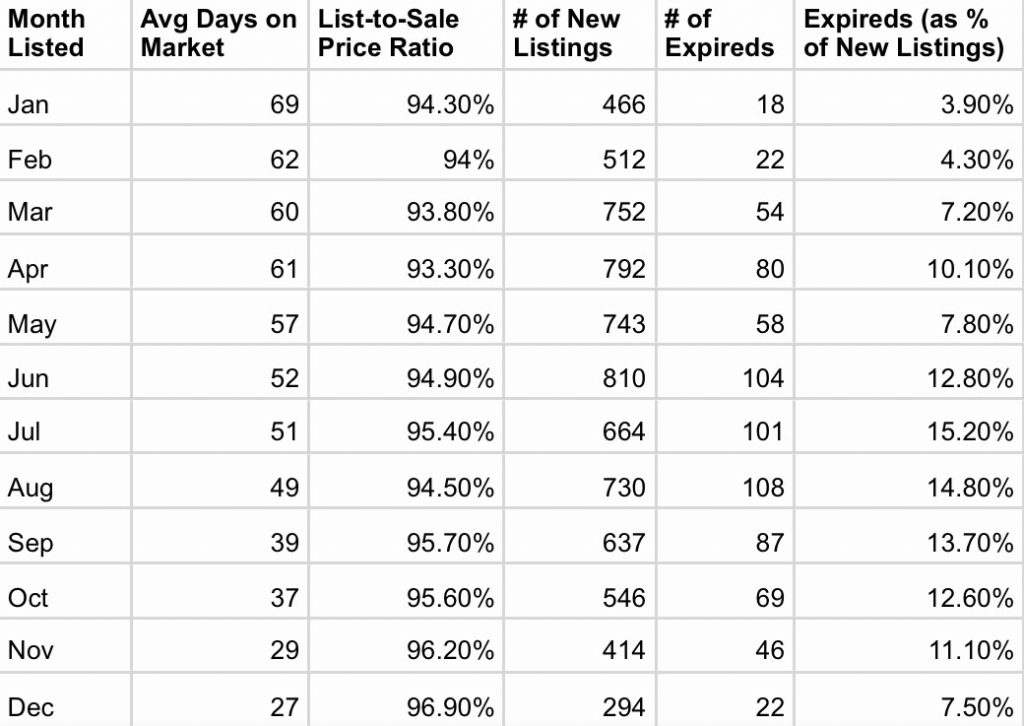
*Average days on market is for the houses that listed in that particular and did eventually close. *List to sale price ratio shows how close to the original asking price owners got for houses listed in that particular month. *# of Expireds is the number of listings listed in that particular month which ended up not selling.
As you can see above, the average days on market was decreasing every month in 2016 so I can’t really say that this gives us any indication to what month is best to list. In my opinion it looks more like a market trend for the year.
On the other hand, list to sale price ratio does seem to be higher in months where there are less new listings signifying that if you list in a month where less competition hits the market, you may be increasing your chances of getting closer to your asking price. Less competition means less to choose from so this makes sense.
As for # of new listings, this tells us which month(s) see the most new listings hit the market. Not a surprise that the most new listings are seen in April, May, and June. So if you’re wondering what the most popular time to list is then this is your answer (Apr, May, and June). However, we’re looking to find out which month is best to list, not most popular.
The next thing I looked at was how many of those new listings ended up expiring (i.e. not selling). As you can see, the highest number of Expireds are seen for properties listed in the Summer (Jun, Jul, and Aug). This is very interesting, not sure what the indicator is but my first assumption is that buyers with children are taking vacations and trips while their kids are out of school. Might be a little less buyer activity due to the season and kids being out of school.
More important than the number of expireds is the percentage of expired listings in direct correlation with the new listings for any given month. In other words, the last thing I wanted to see was which month has the highest percentage of expired listings. This tells us which month you have a higher chance of expiring in. Now obviously all you have to do is price right and you don’t have to worry about expiring, but it is still good to know. So based on this study, the highest percentage of expired listings are seen for properties listed in the Summer & Fall (i.e. Jun – Oct). Aside from those months, expired listing percentage is fairly low.
The Verdict

Okay, so if you looked closely at the chart above you probably had the same initial reaction that I had. It seems very counter intuitive because while most people think Spring & Summer are the best time to list, these stats offer a different perspective. Very eye opening because when we meet with homeowners in November & December, we typically advise them to wait until Jan 1st. However, after performing this completely non-scientific study for properties listed & sold in Queens, it looks like the best months to list a property are actually those slower months (like Nov & Dec) because there is much less competition on the market. January also seems like a good time to list. It makes sense if you think about it, because even though there are more buyers out in the Spring & Summer, there are actually 2-3 times as many listings for sale at that time too. After reviewing this data we will definitely be thinking and advising differently about selling in the fall and winter vs spring & summer.
Ultimately, it all comes down to timing. Whenever we meet with homeowners and they ask us “when is the best time to sell”, we tell them, whenever you are ready. The truth is that you never know where the economy will be, whether interest rates will go up or down, or whether inventory will rise or fall in the near future. Use your own situation and timing as a gauge because as long as you price right and prepare properly, you will get top dollar for your home!
Hope this helps 🙂